はじめに
GraylogではDashboardにて地図にアクセスのあった地域を表示することができます。
このIPアドレスから地域を推定することをGeoIPと呼びますがデフォルトではGeoIP用のデータベースが無いため表示できません。
また設定方法も特別な設定が必要で分かりにくい工程があります。
この方法をメモしておきます。
環境
OS: Rocky Linux 8.6
Graylog: 5.0.11
手順
MaxMindのアカウントを作成
まず、GeoIPのデータベースを取得するため、GeoIPのデータベースを提供しているMaxMind社のアカウントを作成します。

ファイルダウンロード
アカウントを作成後、ログインすると、左側に「Download Files」というメニューがあるので開きます。
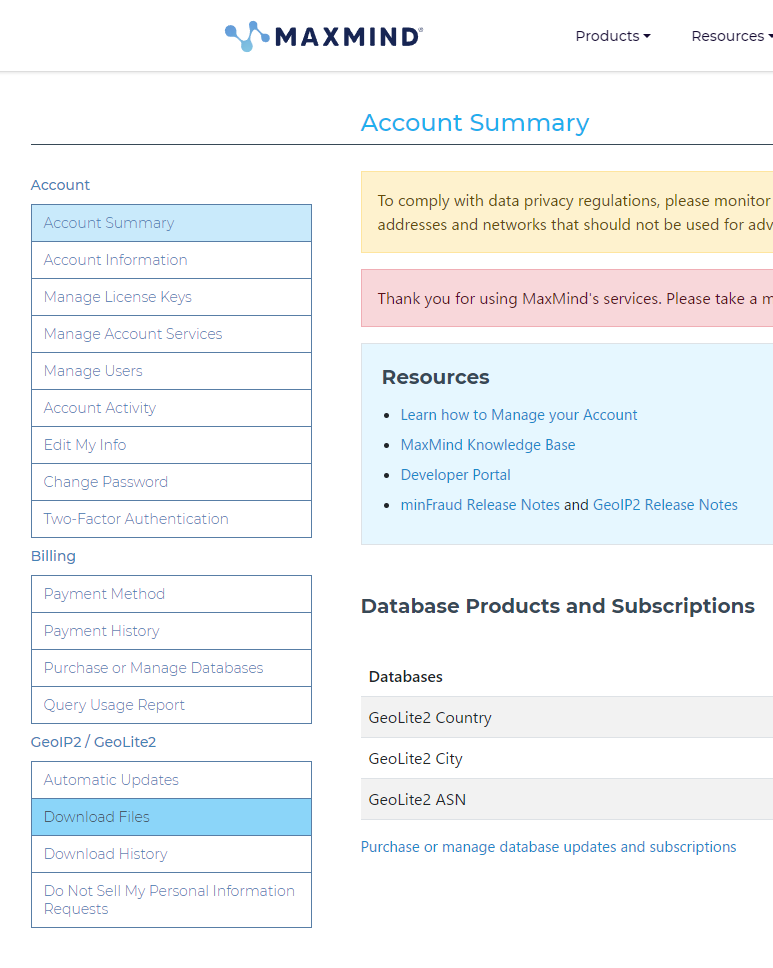
ファイル一覧が表示されるので、「GeoLite2 City」をダウンロードします。
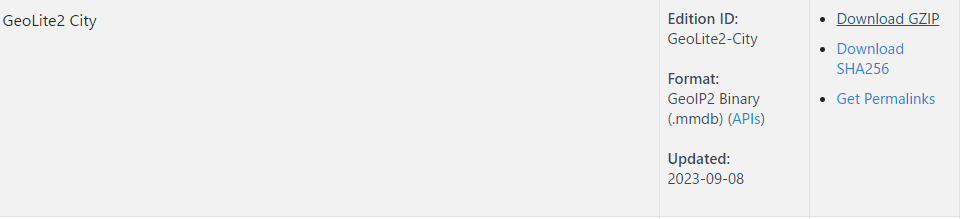
データベースの配置
ファイルを解凍してgraylogの入っているサーバーの「/etc/graylog/server/GeoLite2-City.mmdb」に置きます。
# ls /etc/graylog/server/
GeoLite2-City.mmdb  log4j2.xml  node-id  server.conf
データベースの読み込み
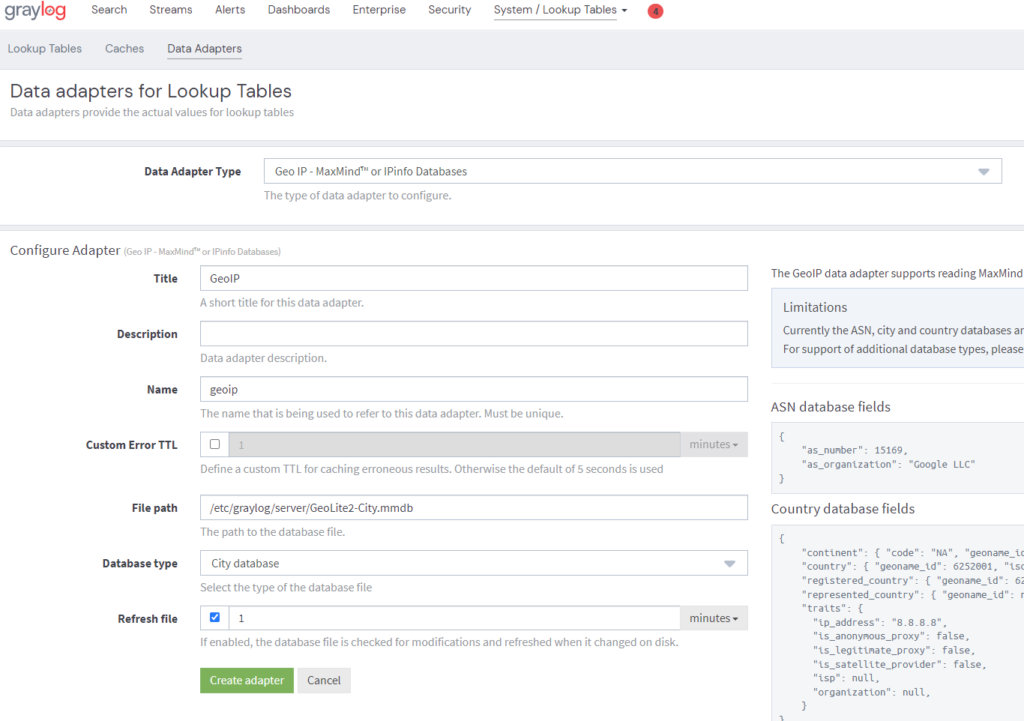
Graylogの画面に移動し、「System > Lookup Tables > Data Adapters」を開きます。
「Create data adapter」をクリックして、DataAdapter Type を 「GeoIP -MaxMind」を選択します。
他はデフォルトで良いです。Titleを設定して「Create Adapter」をクリックして作成します。
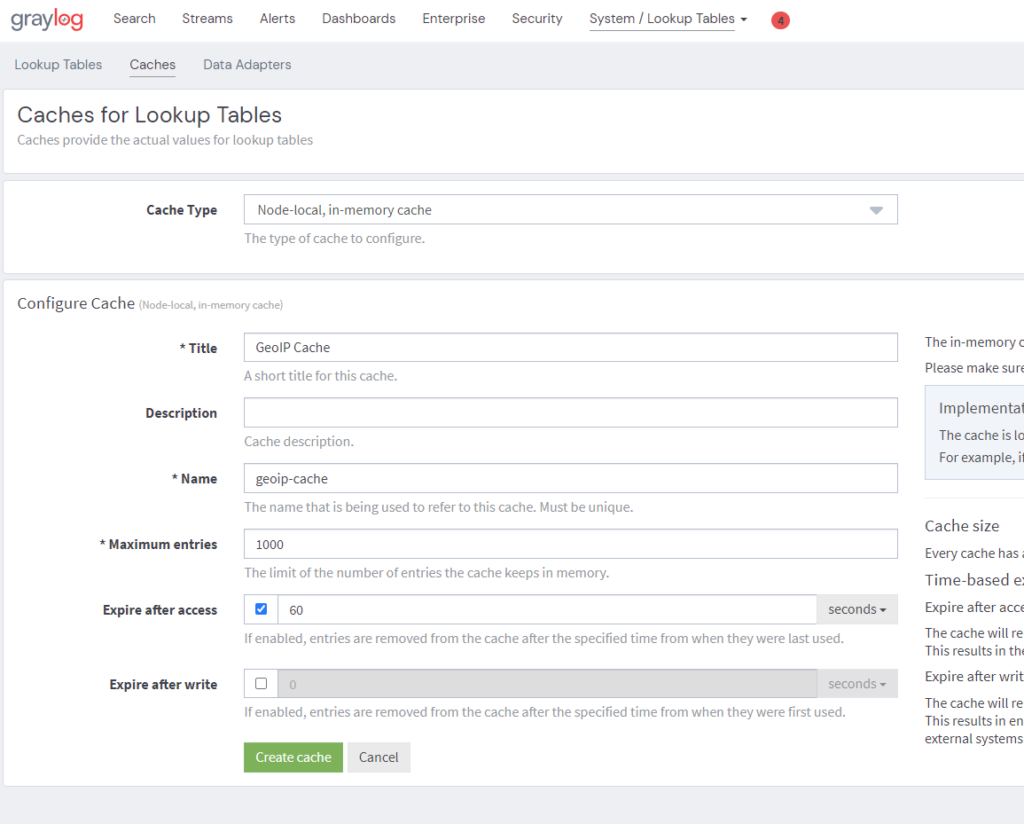
キャッシュの作成
次にキャッシュを作成します。
Lookup Tableの作成
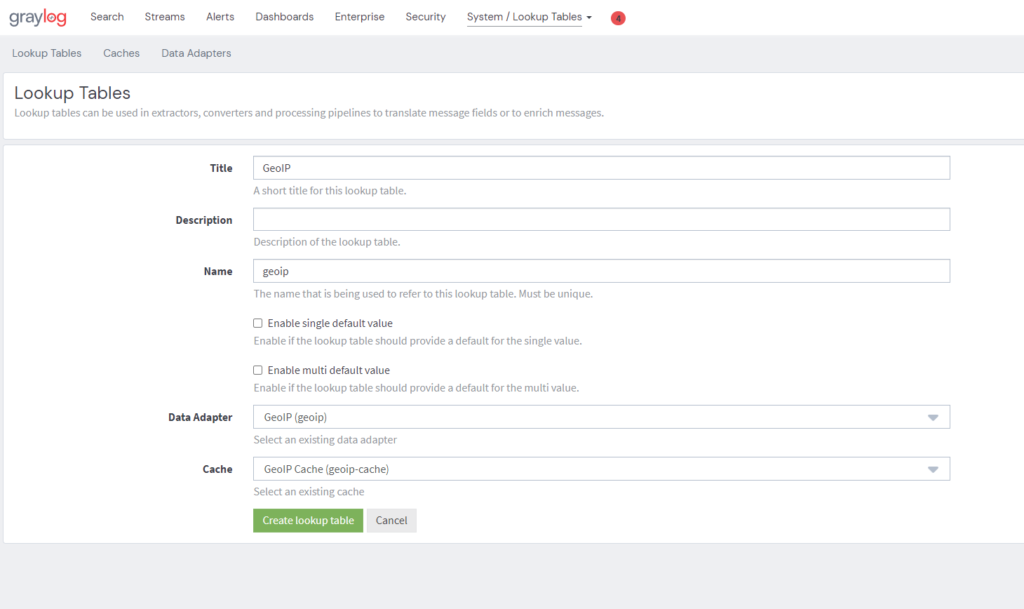
ルールの作成
これだけではデータベースを読み込めるようにしただけですので、実際のIPアドレスをGeoIPで所在地を取得するルールを作成します。
「System > Pipelines > Manage rules」にて次のコードを貼り付けます。
※ meta_req_headers_x-real-ip は自身のIPアドレスのカラムを指定してください
rule "GeoIP lookup: meta_req_headers_x-real-ip"
when
  has_field("meta_req_headers_x-real-ip")
then
  let geo = lookup("geoip", to_string($message."meta_req_headers_x-real-ip"));
  set_field("src_ip_geo_location", geo["coordinates"]);
  set_field("src_ip_geo_country", geo["country"].iso_code);
  set_field("src_ip_geo_city", geo["city"].names.en);
end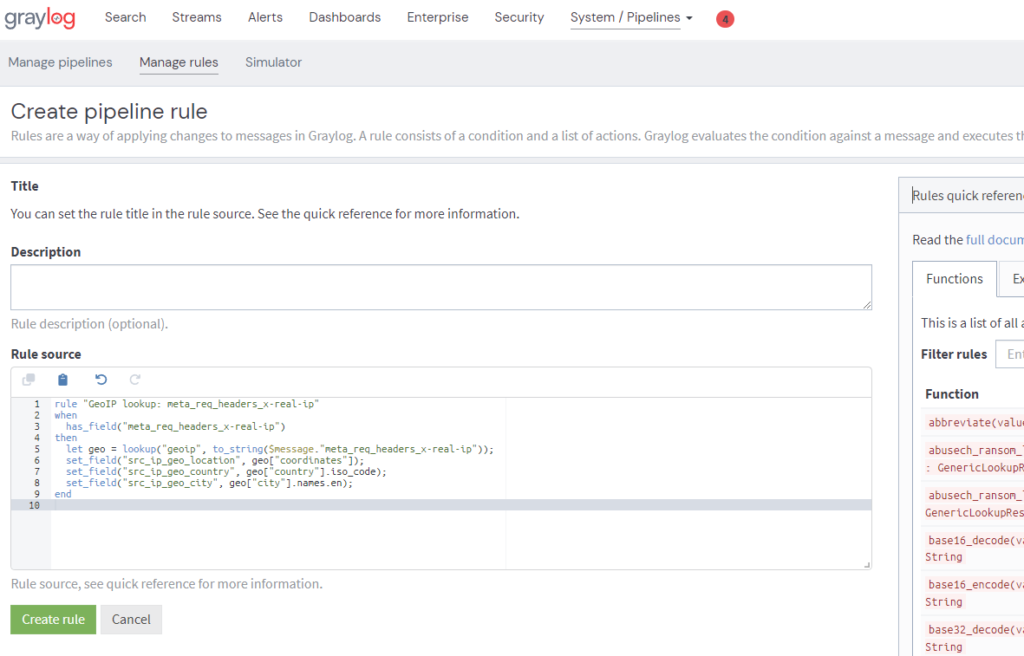
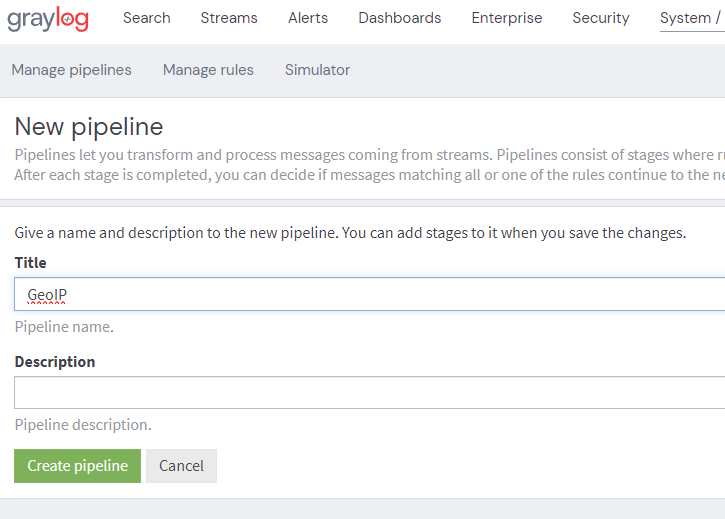
Pipelineの作成
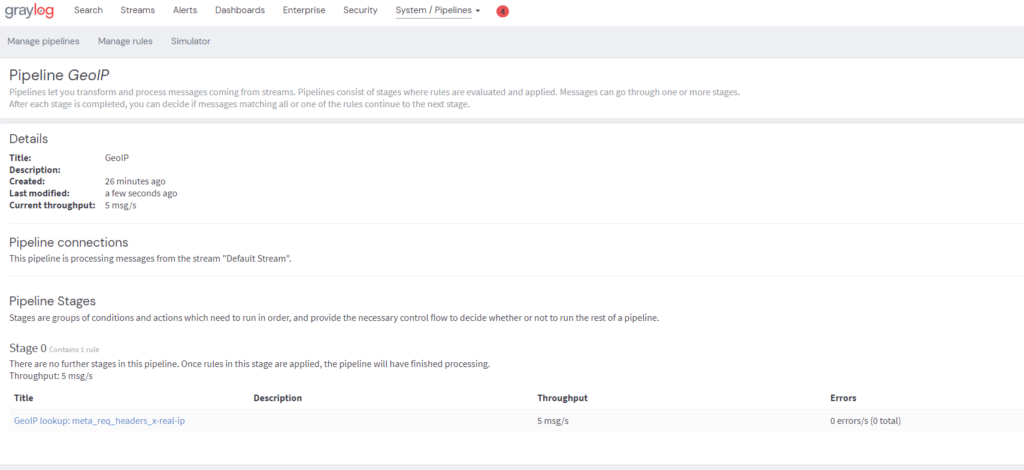
「System > Pipelines > Pipeline」にてPipelineを作成します。
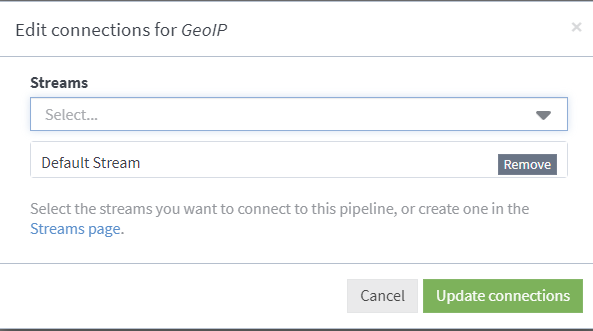
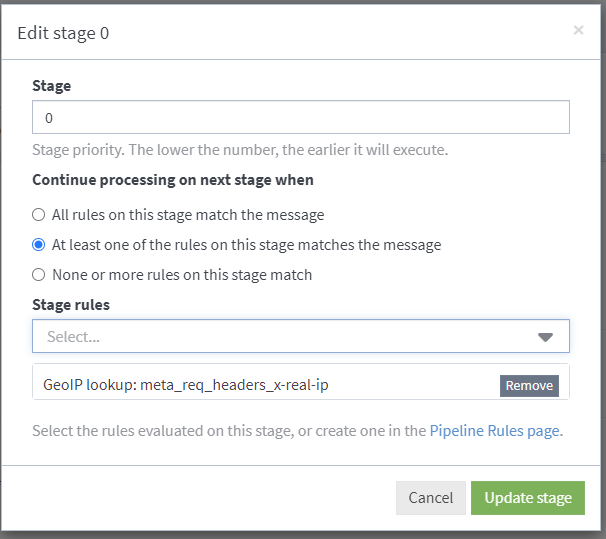
続いて、Editを行い、次のように設定します。
Pipeline Connections
Stage 0
動作確認
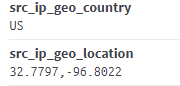
以上で設定完了です。
成功していればメッセージにGeoIPの項目が増えています。
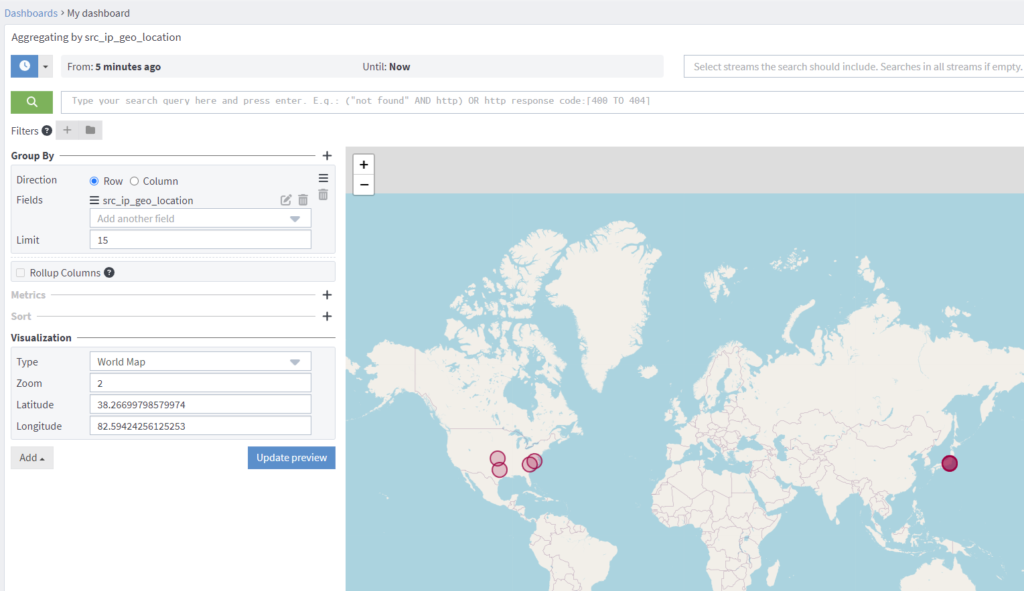
Dashboardでは次のように設定すると地図に反映されます。
参考


コメント